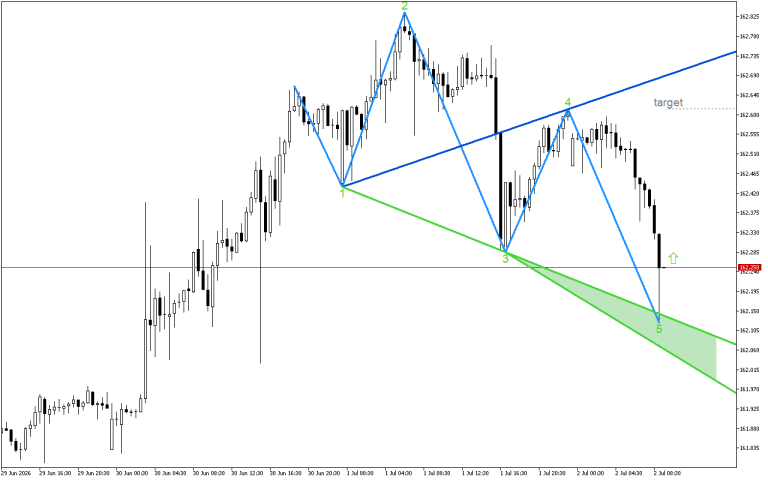
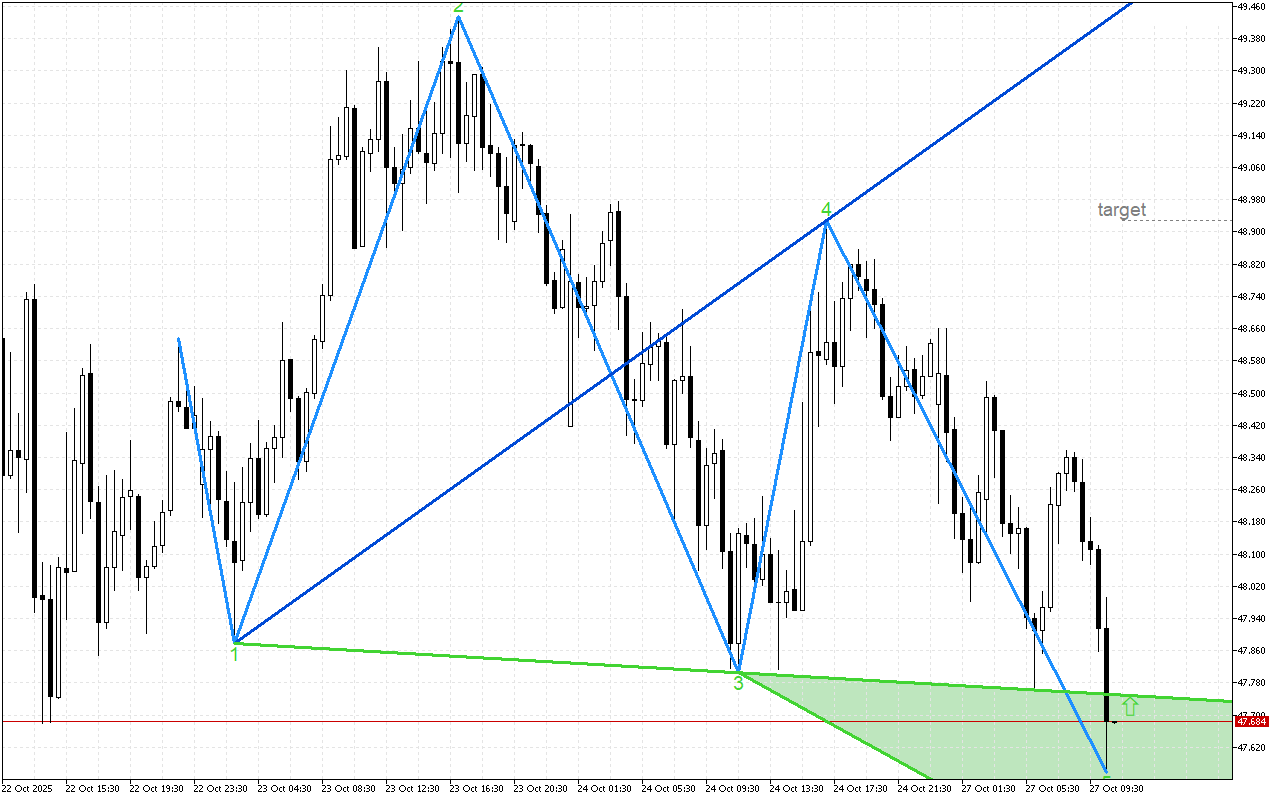
Despite the decline in the price of XAGUSD, the chart is showing signs of an impending impulse in the opposite direction.
The current chart shows the Wolfe Wave pattern, which is a six-leg wave structure. Wave 5 is visible and the XAGUSD price is in the “Sweet Zone” marked in green. Typically, the ascending sixth wave begins here, which reaches the line built along the tops of waves 1 and 4.
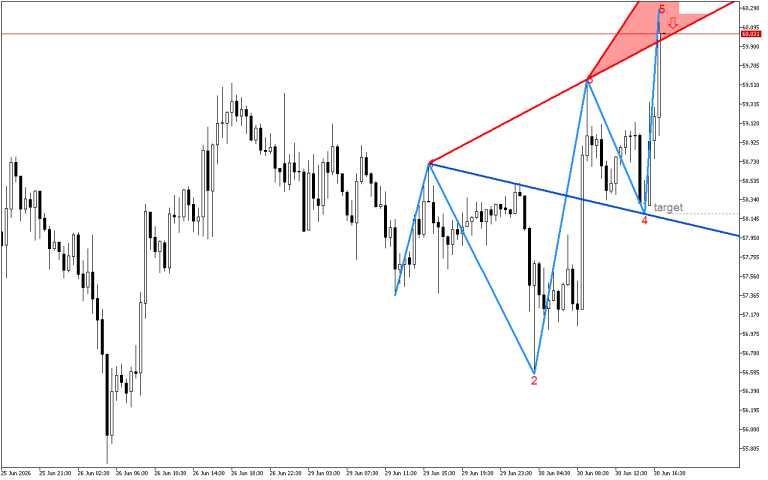
Currently, trading XAGUSD assumes the priority of long positions. A trader can enter the market both at the current levels or when retesting of the resistance level occurs.
📌 Entry: 47.681
✔️ First goal: 48.928
❌ Stop order: 47.370