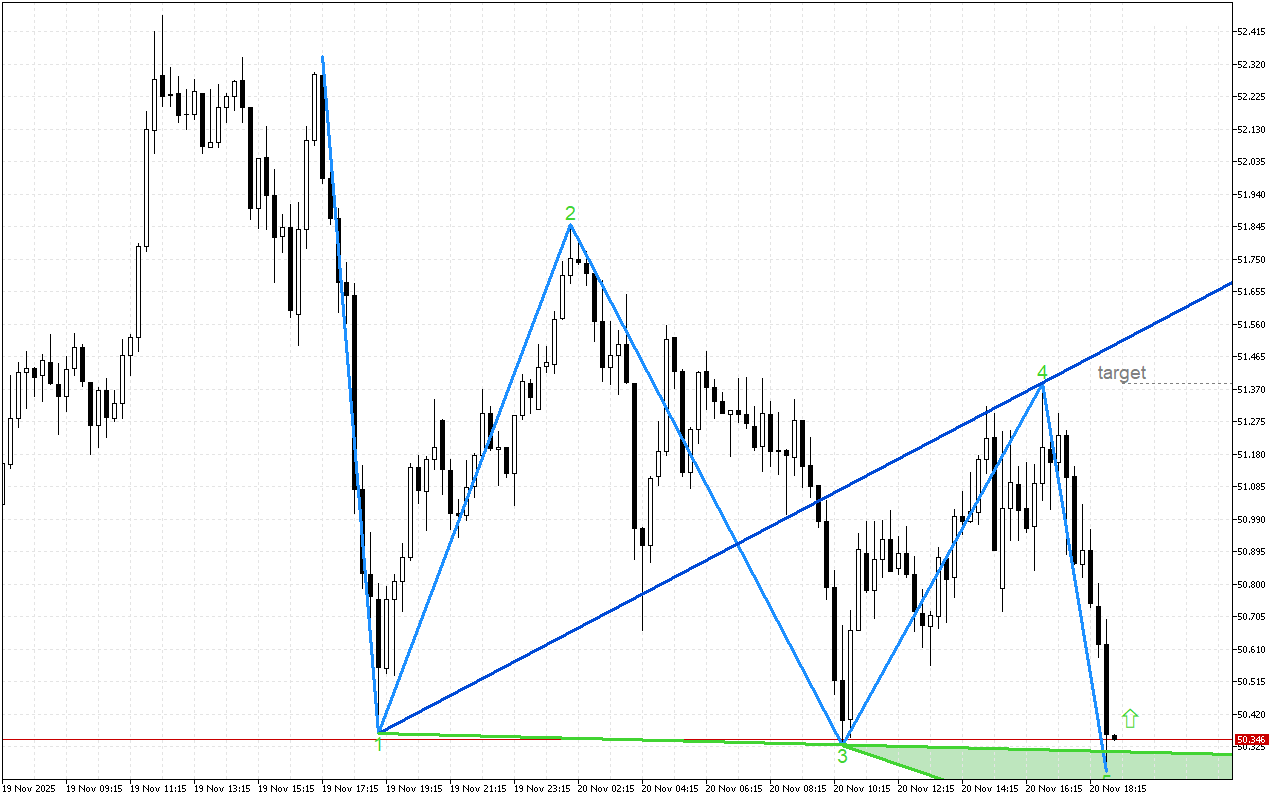
Despite the decline in the price of XAGUSD, the chart is showing signs of an impending impulse in the opposite direction.
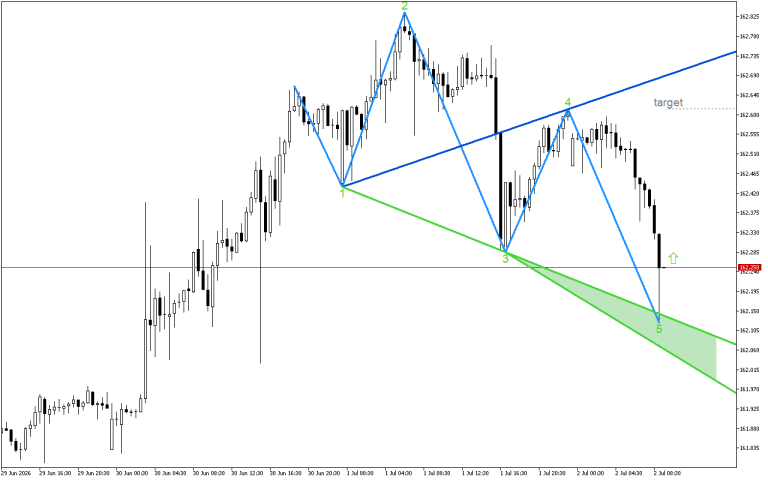
Wolfe Waves of a bullish pattern are forming on the chart, indicating a possible uptrend. If point 5, which is the lower point of the wave, is reached, the model predicts an upward reversal. On the chart, the support area is highlighted in green, and the resistance line is formed through points 1 and 4.
The chart shows, that it might be strategically more profitable to open long positions in XAGUSD.
📌 Entry: 50.360
✔️ First goal: 51.387
❌ Stop order: 50.094