Current chart analysis of Dow Jones points to a reversal pattern.
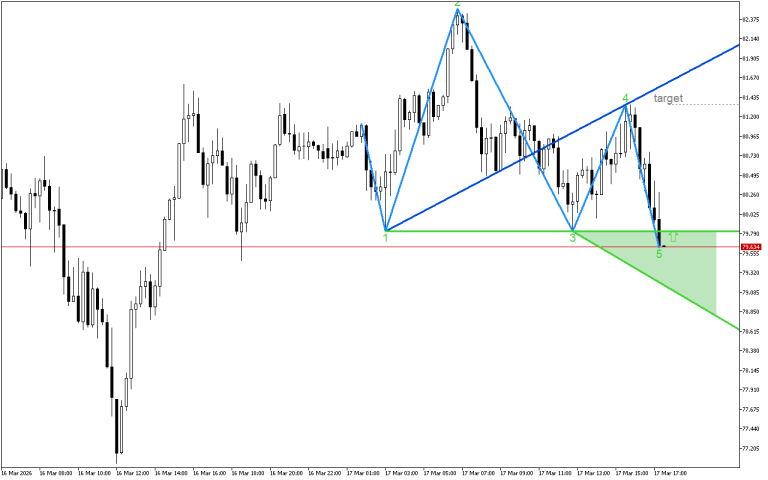
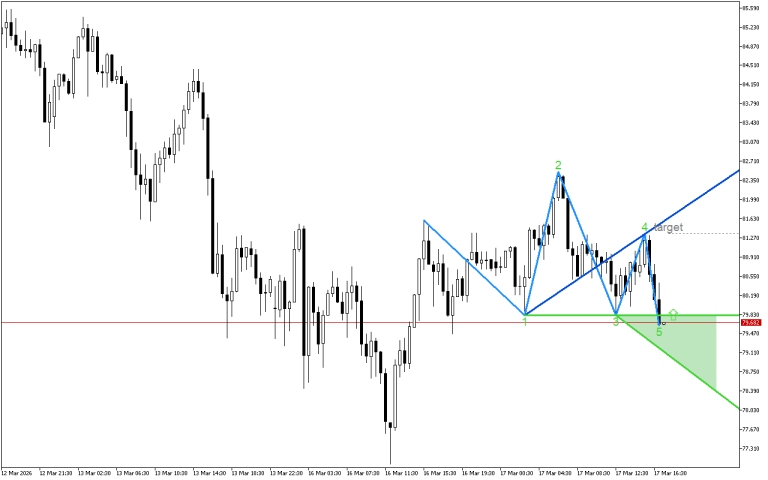
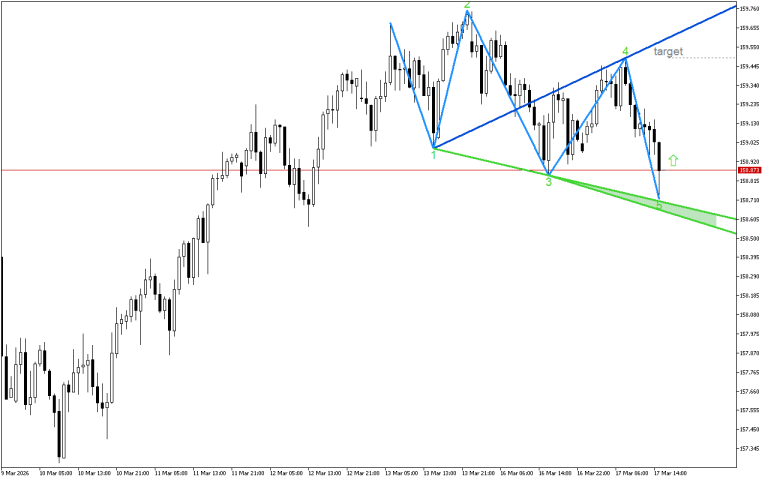
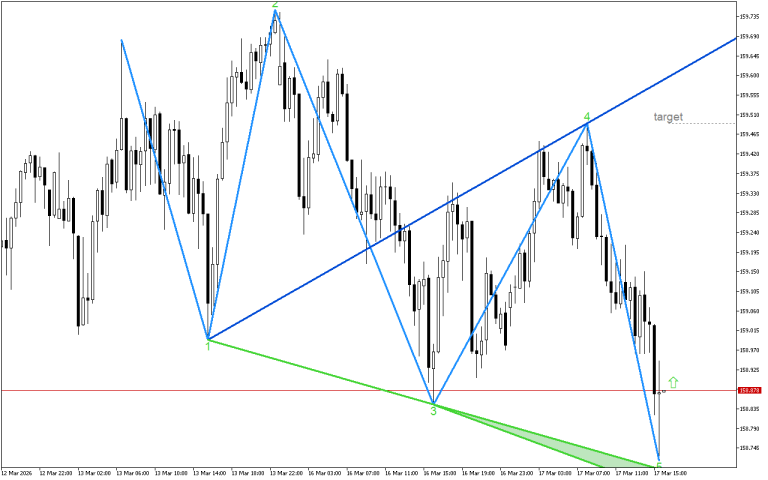
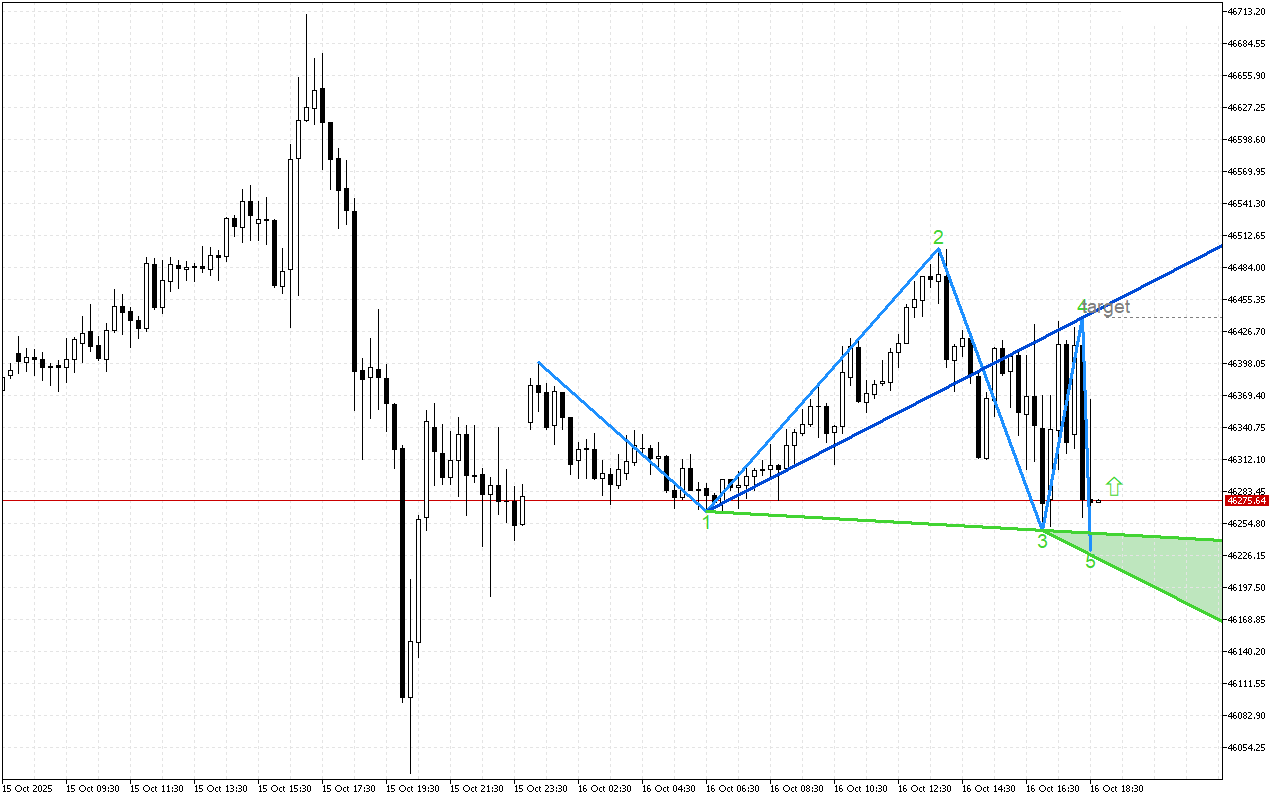
Wolfe Waves of a bullish pattern are forming on the chart, indicating a possible uptrend. If point 5, which is the lower point of the wave, is reached, the model predicts an upward reversal. On the chart, the support area is highlighted in green, and the resistance line is formed through points 1 and 4.
The strategy for Dow Jones should embrace long positions based on this graphical representation. A trader can enter the market either at the current prices or when return to the marked resistance level is implemented.
📌 Entry: 46273.64
✔️ First goal: 46438.64
❌ Stop order: 46203.66