Current chart analysis of XAGUSD points to a reversal pattern.
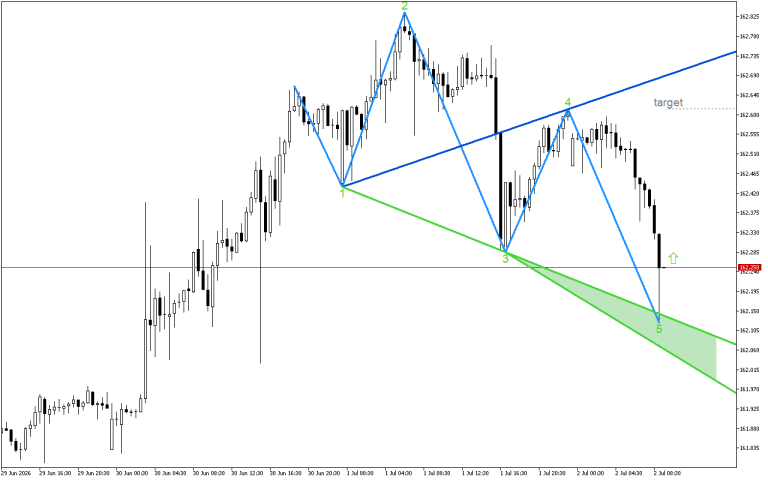
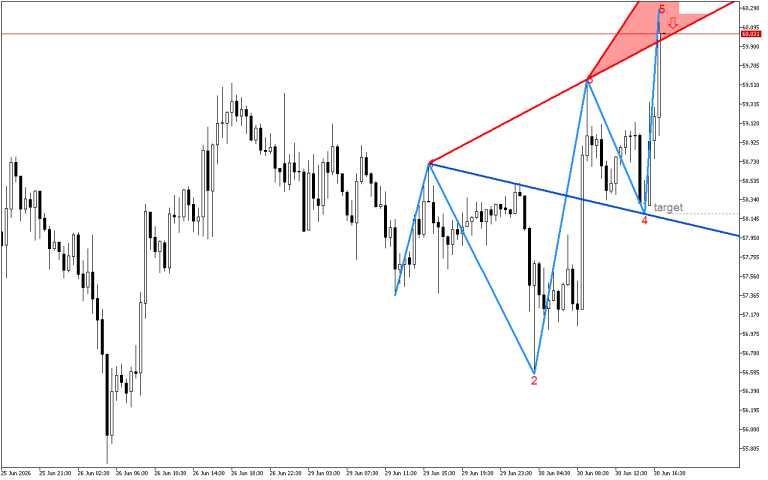
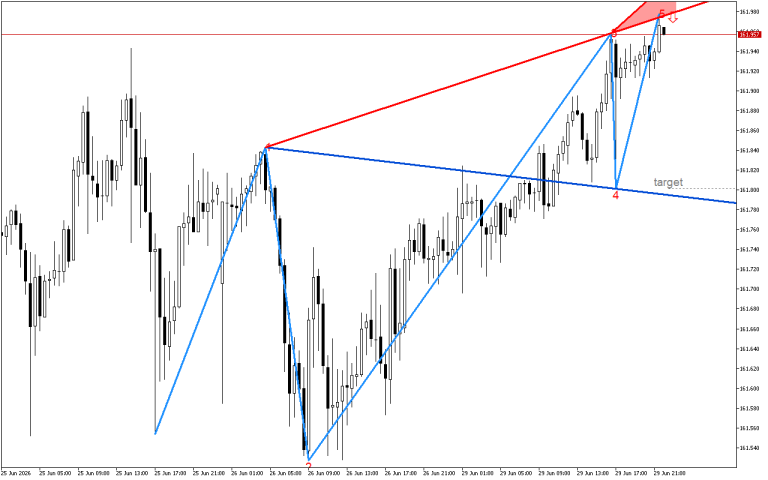
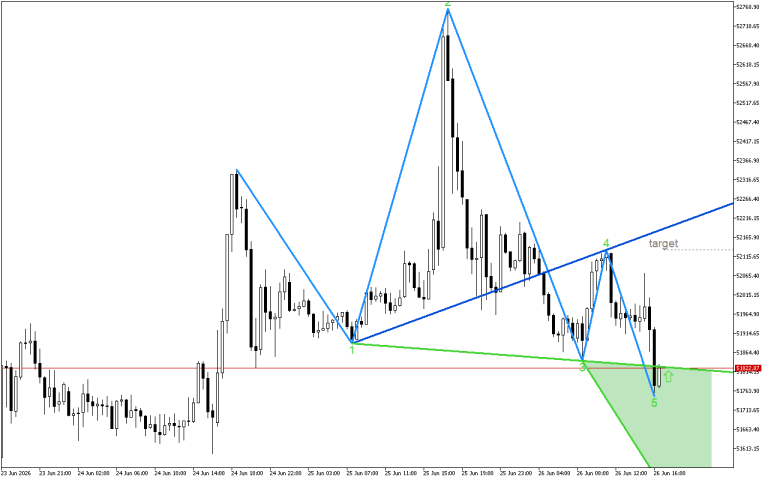
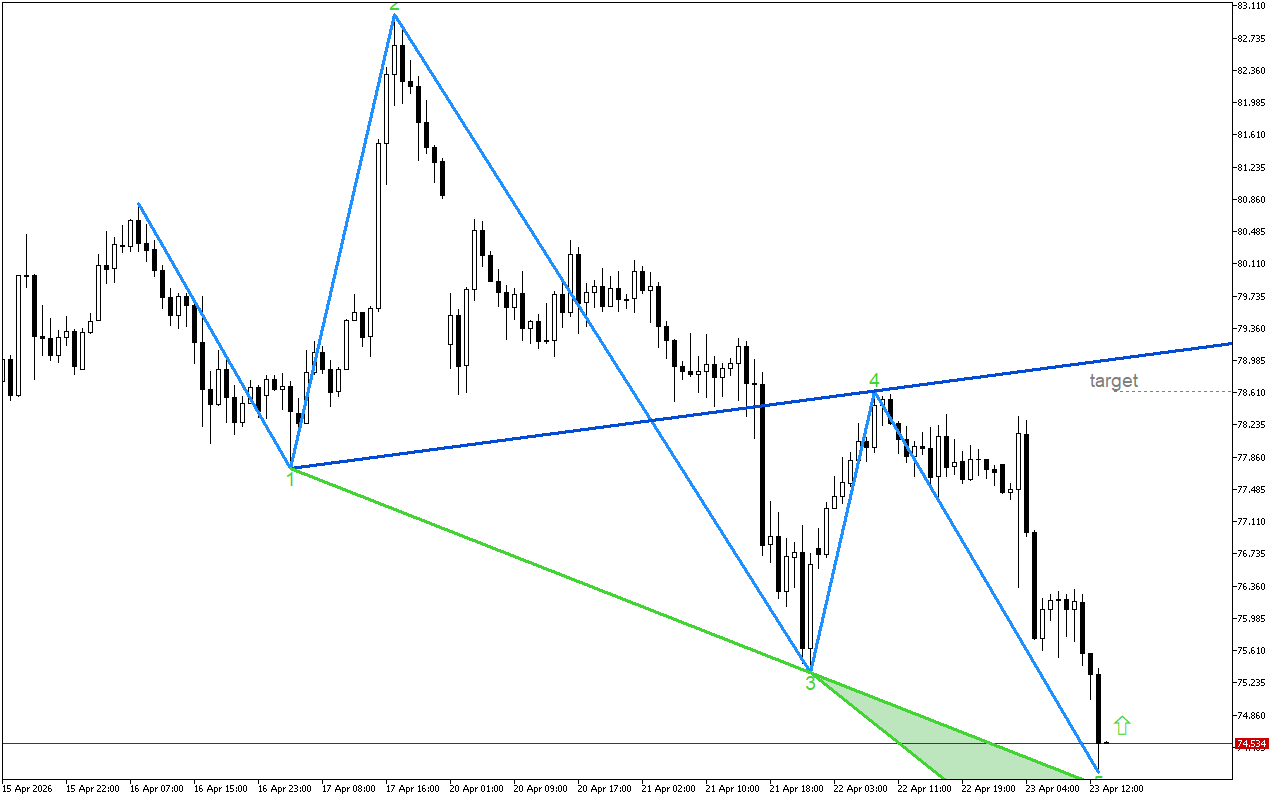
The current chart shows the Wolfe Wave pattern, which is a six-leg wave structure. Wave 5 is visible and the XAGUSD price is in the “Sweet Zone” marked in green. Typically, the ascending sixth wave begins here, which reaches the line built along the tops of waves 1 and 4.
Against this background, it is now advisable to consider the long positions for XAGUSD. Optimal entry points can be either at current prices or when retesting resistance.
📌 Entry: 74.538
✔️ First goal: 78.629
❌ Stop order: 73.307